I come from Slovakia. Despite being a programer, I grew up and lived in the artist community of Bratislava. Nowadays, though, I am living in Switzerland.
I knew that some of the artists from my home city have established ateliers in the old thread factory. Actually, I've spent quite a few days on the premises. But since I moved away, I've heard that the artists haven't managed to make a deal with the owner of the building and that they had to move away.
I've also heard that they've decided to move to the building of the former school of chemistry further away from the center of the city. And that was it. I haven't known much more.
This week, however, I am visiting Bratislava and it turned out that there was a party in the new building.
So I went there and, oh my god, I was impressed.
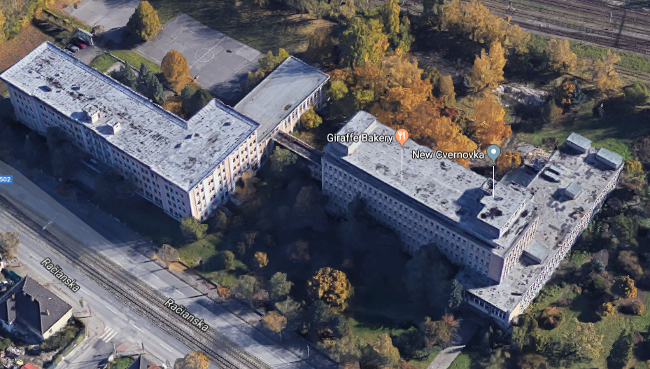
The building is HUGE:
Moreover, it wasn't used before. It must have been in a terrible condition. Just getting it into a usable state must have been a Sisyphean task. How did they managed to do that?
Also, where I remembered maybe few scores of people in the old building, I found that the new humungous building was full of little ateliers and firms. When I've asked around it turned out that they are full. There's no more space to rent out.
As for the party, it was actually a public event (a May Day celebration). I was said that at the previous May Day the number of visitors was 8,000. Assuming there were more people visiting this year, say 10,000, it means that approximately 2% of the entire population of Bratislava have come to visit. And that's, as public events go, huge.
But what really impressed me was that this community of people from the old building, which I thought of as aggregating in a single place mostly because of the low rents, has managed to survive displacement, an event that tends to be fatal for most communities. Apparently, a high level of social capital was built, so high that it withstood even such a heavy blow at the very fabric of the community.
It seems that the entire thing is notable even in the wider European context. I've heard a story how they attended a conference in Kiew, hoping to learn from the experience of others who did similar projects elsewhere. Allegedly, the others didn't even want to believe their story and asked how it was even possible.
At the end of the day I felt proud for "my people". I guess it's a feeling similar to what others may experience when their national team is winning the international football league.
Accidentally, I also met an old friend there, who, as it turns out, now works for a non-profit that tries to get people who have migrated to abroad back home. He asked me whether I was considering returning to Slovakia.
I was not. But the entire experience in Nová Cvernovka definitely swayed me in that direction. And that made me think.
I left Slovakia when Nazis, complete with uniforms, swastikas and torches that they've bought at the local supermarket, got into regional politics.
And in the meantime they've got even to the national parliament.
So, I thought, maybe we can think of these morons as of destroyers of social capital. They directly attack trust in the society and the palpable expression of the trend is people moving away.
And maybe the people who built Nová Cvernovka, on the other hand, are creators of social capital. They create an environment where people want to be. I certainly would. And, again, the measurable expression of the phenomenon is people moving in.
So what if we try to circumvent the methodological problems with measuring social capital (How would you measure social capital of an artistic project? A neo-Nazi movement? And what exactly is social capital in the first place?) and look at migration rates instead? What if we did what Putnam did with bowling leagues, but with countries?
Obviously, the approach has its problems. For example: People are often migrating for economic reasons. Wouldn't that mean that we'd be actually looking at economic statistics rather than social ones?
True, but if we stretch the definition of social capital far enough (e.g. people trusting the local economy) we can get away with it. We'd have one metric that would cover both economic performance and a bunch of hard-to-measure social metrics.
Additionally, Europe has few specifics that make it a good subject for such a study. First, individual member countries of EU are still, in many ways, distinct. There's still a lot of ways how the language, the culture and the economy differs when you cross a border. Thus, one would hope, the per-country statistics would, to some extent, match the natural borders of social groups. Second, there's free movement within the EEA. Therefore the metric won't be distorted by administrative hurdles to migration as they would be if I studied, say, migration from Africa.
So I downloaded the data from Eurostat. In the end I hoped to get a map of main migration trends within EEA.
Unfortunately, the data suck. Emigration data are impossible to collect. As Eurostat website says:
Emigration is particularly difficult to measure; it is harder to count people leaving a country than those arriving. An analysis comparing 2016 immigration and emigration data from the EU Member States (mirror statistics) confirmed that this was true in many countries — as a result, this article focuses on immigration data.
Never mind, I said to myself, let's have a look at immigration data. But it turns out that some countries have sloppy approach to the statistics collection. They don't report immigration per citizenship. And the most sloppy country is, you've guessed it, Germany! It's closely followed by Poland and UK.
Anyway, what that means is that you can't get full emigration statistics per country. You get detailed statistics about how many people have emigrated to Luxembourg, but you have no idea of the number emigrated to Germany or Poland. And given how important Germany, Poland, Greece and UK are when it comes to intra-European migration trends, it makes the results much less useful.
Shrug.
Anyway, so that all the work is not wasted, here's the country/citizenship immigration matrix in JSON format. The top level dictionary is reporting country, the second-level dictionary is citizenship of the immigrant. The value is the number of immigrants with the particular citizenship to the reporting country. The entire dataset is based on statistics for year 2016.
And here's an attempt at least a partial representation of the migration data.
It's based on net migration flows. If 1000 people emigrated fro Austria to Belgium and 300 people from Belgium to Austria, I've considered it to be net flow of 700 people from Austria to Belgium.
Moreover, I've normalized the numbers based on the population of the country (number of migrants per million citizens) so that the numbers can be compared even between big and small countries.
Positive number means that the country have gained people, negative number means it have lost people.
Looking at the following table, you may decide to look at data for Austria. It turns out that 3.33 Belgians per million Austrians have moved to Austria. Or that 245.96 Austrians per million Austrians have moved to Switzerland.
So, I am not sure how useful this is, but here's the full table anyway:
Austria
Belgium
Bulgaria
Croatia
Cyprus
Czech Republic
Denmark
Estonia
Finland
France
Germany
Greece
Hungary
Iceland
Ireland
Italy
Latvia
Liechtenstein
Lithuania
Luxembourg
Malta
Netherlands
Norway
Poland
Portugal
Romania
Slovakia
Slovenia
Spain
Sweden
Switzerland
United Kingdom
Austria
3.33
408.71
442.16
88.04
2.3
3.68
14.14
67.58
1133.39
-0.23
351.48
-5.4
18.73
6.78
33.79
-1.38
1370.62
486.76
249.18
-4.6
-245.96
Belgium
-2.56
307.75
28.11
15.21
5.48
4.77
19.18
410.39
38.02
0.62
396.69
0.09
19.27
-95.66
456.1
5.57
953.84
39.08
10.26
58.08
5.04
-93.8
Bulgaria
-497.08
-486.6
-5.03
-348.07
-191.23
-9.65
-25.16
-194.72
-13.28
-12.44
-366.8
0
-1.12
-28.38
-506.03
-92.96
-0.98
-19.15
-103.3
-716.26
-110.99
-210.1
-965.5
Croatia
-917.99
-75.88
8.59
-59.18
-98.08
-0.72
-6.68
-43.91
-8.59
-24.82
-94.02
0.24
2.15
-42.48
-73.26
-131.48
-0.72
-19.09
-149.86
-363.19
-108.1
Cyprus
Czech Republic
-72.58
-16.3
235.93
23.5
-30.7
-3.98
-0.19
17.15
164.4
-10.14
61.02
-0.19
7.96
-7.2
-20.09
-9.66
295.91
1274.32
3.32
-3.51
-72.67
Denmark
-3.5
-10.86
239.7
72.01
56.77
21.03
52.92
100.57
125.98
128.43
244.6
0.18
293.31
-14.02
27.51
102.33
724.17
96.72
8.24
65.36
-122.3
-46.43
Estonia
-24.32
-41.04
52.43
2.28
31.92
-91.19
-1289.57
4.56
22.04
-13.68
130.7
0
114.75
-31.16
-88.15
-149.7
34.2
42.56
9.88
-220.37
-67.63
Finland
-22.42
-39.55
32.8
5.1
0.36
-55.04
309.26
-6.01
14.03
-0.91
31.89
0
22.6
-19.86
-90.21
-47.75
65.42
14.76
2.73
-116.82
-449.77
-69.43
France
-8.81
-69.56
20.88
2.76
-2.71
-8.6
-0.09
0.49
4.62
181.42
2.58
-41.47
-22.75
111.01
4.75
-0.22
19.78
-4.98
-249.33
Germany
Greece
Hungary
-1003.1
-43.74
9.66
3.66
-176.49
-73.14
-2.95
-7.83
-31.33
-9.05
-1.83
-0.41
3.05
-18.62
-176.59
-19.02
265.3
74.56
-13.22
-73.75
-262.75
Iceland
6.01
-21.05
267.65
312.75
321.78
-2204.32
54.13
15.04
267.65
195.47
-3.01
1768.27
-84.2
-174.42
-1124.71
688.66
318.77
33.08
-1831.42
-165.4
Ireland
Italy
-50.41
-73.96
43.25
6.49
-10.62
-23.01
-2.84
-2.88
-199.55
0.3
-1.07
-0.23
2.95
-29.54
-71.98
-8.9
732.77
3.64
-6.48
-322.95
-18.87
-265.97
-448.06
Latvia
Liechtenstein
1249.27
-26.58
0
-26.58
53.16
-26.58
0
0
106.32
26.58
372.12
0
-26.58
-53.16
-26.58
0
53.16
0
132.9
-318.96
Lithuania
-56.43
-75.47
2.77
-3.12
-29.08
-579.53
-52.28
-42.93
-59.55
-10.39
-203.56
-61.97
0
-37.74
-318.84
-848.87
22.16
0
-2.42
-339.27
-474.63
-95.2
Luxembourg
-102.39
1877.66
352.28
308.89
131.89
138.83
71.15
189.15
4801.74
317.57
48.59
3109.77
1.74
189.15
182.21
15.62
1105.42
145.77
107.59
203.04
-232.54
Malta
Netherlands
-17.32
-303.84
213.2
18.08
12.49
-9.25
6.83
29.15
89.4
102.24
3.42
257.2
0.12
54.24
-6.18
-1.77
195.95
44.35
10.78
-5.01
-20.85
-69.44
Norway
2.3
-12.08
127.54
105.68
19.56
-112.01
37.78
50.25
35.87
71.73
103.57
0.19
470.27
-1.73
5.75
225.55
40.28
7.67
-13.43
-15.15
-31.26
Poland
Portugal
Romania
-603.48
-545.99
0.35
0.15
-158.04
-209.16
-2.28
-18.17
-374.89
-131.98
-11.59
-2249.66
0
-3.24
-32.24
-168.37
-59.51
-18.12
-5.97
-1445.98
-109.01
-120.54
-3103.7
Slovakia
-780.47
-81.46
25.25
14.74
-2478.51
-101.73
-10.32
-14.93
-58.42
-135.08
-19.53
-40.73
-0.37
0
-15.48
-138.77
-38.7
65.98
-11.79
-28.93
-296.89
Slovenia
-1050.29
-56.2
358.01
304.24
-16.96
-22.77
-6.3
-7.27
7.27
62.98
-5.33
190.39
0
3.39
-30.04
-88.65
-19.38
57.17
31
-35.36
-358.49
Spain
-14.15
110.34
-8.03
13.8
-28.42
421.88
21.1
1.83
1.51
615.27
11.48
-81.8
-43.88
Sweden
4.06
-5.79
80.6
154.5
3.76
70.86
29.44
250.53
33.7
73.6
61.82
116.23
-0.51
139.17
-11.88
35.94
8.02
218.66
15.94
7.41
-54.11
-60.91
Switzerland
256.99
127.41
180.49
54.4
92.11
31.82
10.69
45.75
310.19
6.6
1937.64
1.44
33.02
16.09
141.59
19.57
286.05
193.46
88.87
456.22
72.05
United Kingdom
105.64
254.47
415.74
938.02
31.17
If you are interested in global net migration rates, you can find estimates on Wikipedia.
That table also shows the problem with such large-scale aggregations. The countries with the highest social capital, apparently, are Oman and Libanon. In fact, these high numbers are rather caused by people fleeing war in Yemen and Syria, respectively, who are prevented from going elsewhere by immigration policies.
May 3rd, 2018